I’m a geek and a gamer but not a gamer geek. That is to say I don’t really know anything about PC components or how they are best assembled to achieve maximum FPS. I don’t have (that) strong feelings about specific brands of PC components (ok, I am pretty fond of my Noctua fans). My desktop is ancient by any gaming standards (8 years and counting) but I like it and I fully intend to celebrate our ten year anniversary. It recently got a very modest upgrade in the form of a new GPU (AMD RX 7600). I enable FSR2 wherever I can and because resolution is 1080p/1200p, I’m now mostly CPU constrained. With an old overclockable processor (Intel i5 7600K) that (I believed) had never actually been overclocked, I figured it was time to see if I could teach an old dog some new tricks.
This is not an overclocking guide. I don’t really know anything about overclocking; I just followed a motherboard and CPU specific guide. It’s a couple of observations tied mostly to overclocking an old system that runs linux. Is there anything special about overclocking when using linux? In principle no. I used UEFI/BIOS settings to accomplish the task rather than desktop applications (that are mostly Windows specific anyway). But overclocking made me look in to aspects of my hardware and it’s linux support that I had never previously considered seeing as it was Just Working™.
I’m running at stock speed… right?
Have you ever thought to yourself “I wish my PC was running overclocked but it isn’t” and felt sad only to discover that actually it was already overclocked? No? Just me then. After reading and investigating stuff for a couple of hours I ran the following command in a terminal:
watch -n1 "grep \"^[c]pu MHz\" /proc/cpuinfo"watch is basically cat, sleep and clear combined; keep printing the contents of a file at an interval of n (and overwrite the previous printout with the new). In this case I am grep’ing the frequency bit for the CPU’s four cores out of cpuinfo in order to see a constantly updating picture of what frequency they are running at. And it told me that they were all right around 4300 Mhz rather than the (stock) 3800 MHz I was expecting from a 7600K. A quick peek into the BIOS confirmed that yes, it had actually already been assigned a multiplier of 43 across all four cores.
There’s not much to this but I realized it’s sensible to check whether there actually are any potential gains still left on the table. Apparently the guy who helped me build the thing (read: did all the actual work while I handed him a tool or component every now and again) had already given it a decent but undemanding overclock (i.e. no extra voltage required).
Where are my (adoring) fans?
Anybody who has been using linux on the desktop for more than a couple of months knows about lm_sensors. You install it, you run sensors-detect (or maybe your installer did it for you) and you say yes, yes and yes. With a bit of luck (and sensible hardware picks) running sensors afterwards should show you all the temps, the fan speeds and the voltages your system is capable of. As I said I hadn’t engaged much with it so far. So it was only when I started looking for those fan speeds when I realized they weren’t showing up.
Any overclocking guide will tell you to make sure you have sufficient cooling before you begin. I could check the temperatures but I wanted to make sure that the fans were working properly and in response to temperature changes. If not, stress testing would be, well, stressful for me as well as the CPU.
What made this particularly tricky was that I wasn’t actually sure if the OS or the BIOS was managing fan speeds. The general rule is that while most motherboards allow for (as in: have the necessary linux driver support for) OS control of fans, most users are well-advised to leave control to the (often untouched default) BIOS controls unless they have particular needs. Now, I was happy to control the fans via ASUS’ QFan Control settings in the BIOS but I needed to be sure that the OS (EndeavourOS) hadn’t taken charge of them without actually being able to engage then when needed. In other words: I needed to know who was in charge, the BIOS or the OS? Actually being able to see fan speeds would be helpful here, especially if I were to trust the OS with their management.
I ran sensors-detect a couple of times and said yes to even the items it tried to dissuade me from. No changes. So my first course of action was to try to establish beyond any doubt that the fans were under the control of the BIOS. If I could be sure of that, then being able to see fan speeds in linux wouldn’t be that important.
The simplest possible way to do that was simple: In the BIOS I set up a manual fan control curve. If you’re unfamiliar with the concept: A fan control curve is simply a set of instructions telling the motherboard when to ramp up the fan. E.g. when CPU temperature hits 40°C take the fan up (or down) to 50% of max. RPM (rounds per minute). This particular fan curve basically said “Run them at nearly full tilt all the time, regardless of temperature”. If the OS took over control at some point, I would notice, because I knew that I wasn’t used to this level of noise from the fans. And sure enough, neither Windows nor Linux took the fans down from the 80% speed I had assigned to them.
Ah but what about adjustments? Could I trust that the BIOS was checking temperatures and make adjustments in response? Currently it was just all out all the time. This is also actually trickier than you think because most fan curves are designed to be not noticeable. Now, I wanted to notice them and since I couldn’t check fan speeds on the command line my ears would have to do the job instead. What I found was that a simple curve (really a straight line) that starts at 20°C/30% and goes straight to 55°C/100% (i.e. a 2% increase per 1°C) is highly noticeable because the fans are constantly adjusting to every minor change in temperature. And sure enough the BIOS was managing fan speed adjustments just as I had asked for.
I should add that I kept this very aggresive fan curve on for most of my initial testing just to be on the safe side and managed to stay mostly below 60°C as a result (while running with an open case, i.e. no side panels which also helped with keeping an eye and en ear on things).
It was only after all this that I came upon a relevant entry in the Arch wiki. I used the kernel paramenter acpi_enforce_resources=lax for a one time boot and ran sensors-detect one more time. (BTW yes, I have seen the wiki’s note but it worked* for me). And this time I saw a completely new module:
nct6793-isa-0290
Adapter: ISA adapter
in0:                      608.00 mV (min =  +0.00 V, max =  +1.74 V)
in1:                        1.01 V  (min =  +0.00 V, max =  +0.00 V)  ALARM
in2:                        3.41 V  (min =  +0.00 V, max =  +0.00 V)  ALARM
in3:                        3.33 V  (min =  +0.00 V, max =  +0.00 V)  ALARM
in4:                        1.02 V  (min =  +0.00 V, max =  +0.00 V)  ALARM
in5:                      144.00 mV (min =  +0.00 V, max =  +0.00 V)  ALARM
in6:                        0.00 V  (min =  +0.00 V, max =  +0.00 V)
in7:                        3.41 V  (min =  +0.00 V, max =  +0.00 V)  ALARM
in8:                        3.17 V  (min =  +0.00 V, max =  +0.00 V)  ALARM
in9:                        1.22 V  (min =  +0.00 V, max =  +0.00 V)  ALARM
in10:                     672.00 mV (min =  +0.00 V, max =  +0.00 V)  ALARM
in11:                       1.23 V  (min =  +0.00 V, max =  +0.00 V)  ALARM
in12:                       1.02 V  (min =  +0.00 V, max =  +0.00 V)  ALARM
in13:                     224.00 mV (min =  +0.00 V, max =  +0.00 V)  ALARM
in14:                       1.12 V  (min =  +0.00 V, max =  +0.00 V)  ALARM
fan1:                     1244 RPM  (min =    0 RPM)
fan2:                     1269 RPM  (min =    0 RPM)
fan3:                     1814 RPM  (min =    0 RPM)
fan4:                        0 RPM  (min =    0 RPM)
fan5:                        0 RPM  (min =    0 RPM)
fan6:                        0 RPM  (min =    0 RPM)
SYSTIN:                    +22.0°C  (high = +98.0°C, hyst = +95.0°C)  sensor = thermistor
CPUTIN:                    +32.5°C  (high = +80.0°C, hyst = +75.0°C)  sensor = thermistor
AUXTIN0:                  +127.5°C    sensor = thermistor
AUXTIN1:                   +45.0°C    sensor = thermistor
AUXTIN2:                   +14.0°C    sensor = thermistor
AUXTIN3:                   +19.0°C    sensor = thermistor
                                    (crit = +100.0°C)
PECI Agent 0 Calibration:  +47.5°C
PCH_CHIP_CPU_MAX_TEMP:      +0.0°C
PCH_CHIP_TEMP:              +0.0°C
PCH_CPU_TEMP:               +0.0°C
PCH_MCH_TEMP:               +0.0°C
TSI2_TEMP:                +3892314.0°C
TSI3_TEMP:                +3892314.0°C
TSI4_TEMP:                +3892314.0°C
TSI5_TEMP:                +3892314.0°C
TSI6_TEMP:                +3892314.0°C
TSI7_TEMP:                +3892314.0°C
intrusion0:               ALARM
intrusion1:               OK
beep_enable:              disabled
The attentive reader may notice something slightly odd here. Some parts of my system are almost at the temperature of the Sun’s corona (5M Kelvin). Not the center of our star, mind you, just the outermost bits, but still, pretty toasty. Clearly something is off here. Also the many ALARMs about voltages which seem to be down to the system thinking that a max voltage of 0 mV makes sense and anything above it is dangerous. I suspect bad driver support for my ASUS Z270-A PRIME. I guess it only goes to show that you still (well, in 2017 at least) cannot take linux support for granted, even when respectable outlets vouch for it. Phoronix commenter Andy Chow is clearsighted when he notes, that…
Probably the sensors don’t work. I have a ASUS sabertooth motherboard, has tons of temp sensors on the board, but you can only read most of them by using the Asus windows only software. They don’t work with “sensors” in linux. Everything else works.
Comment on ASUS PRIME Z270-P Kabylake Motherboard Works Fine On Linux
Phoronix.com, 25 January 2017, 12:23 PM
What it also shows is that even though, the fan speeds look just about right, I cannot – at least should not – trust them. When the driver gets so many things so wrong, nuh uh. Also this doesn’t inspire confidence:
[ ~ ] sudo dmesg | grep NCT6793
[   18.996373] nct6775: Found NCT6793D or compatible chip at 0x2e:0x290
“or compatible”. Eh, close enough.
Incidentally, I was also hoping to be able to use one of those inX readings to check when I started overvolting. I still don’t know what any of them correspond to or if they are trustworthy. So I just ignored them. There doesn’t seem to be much need to check up on overvolting anyway; if you’re achieving the clock frequencies you’re aiming for and nothing’s smoking or crashing, it’s probably working.
Look at me, I am the meme now
You know that Hollywood hacker screen? Not the silly green Matrix one, nor the silly Mr. Robot animated ones. I’m thinking of the silly tmux/GNU screen ones with ridiculous amounts of constantly updating information overload? I would have sworn that would never actually be useful but it kinda was here.
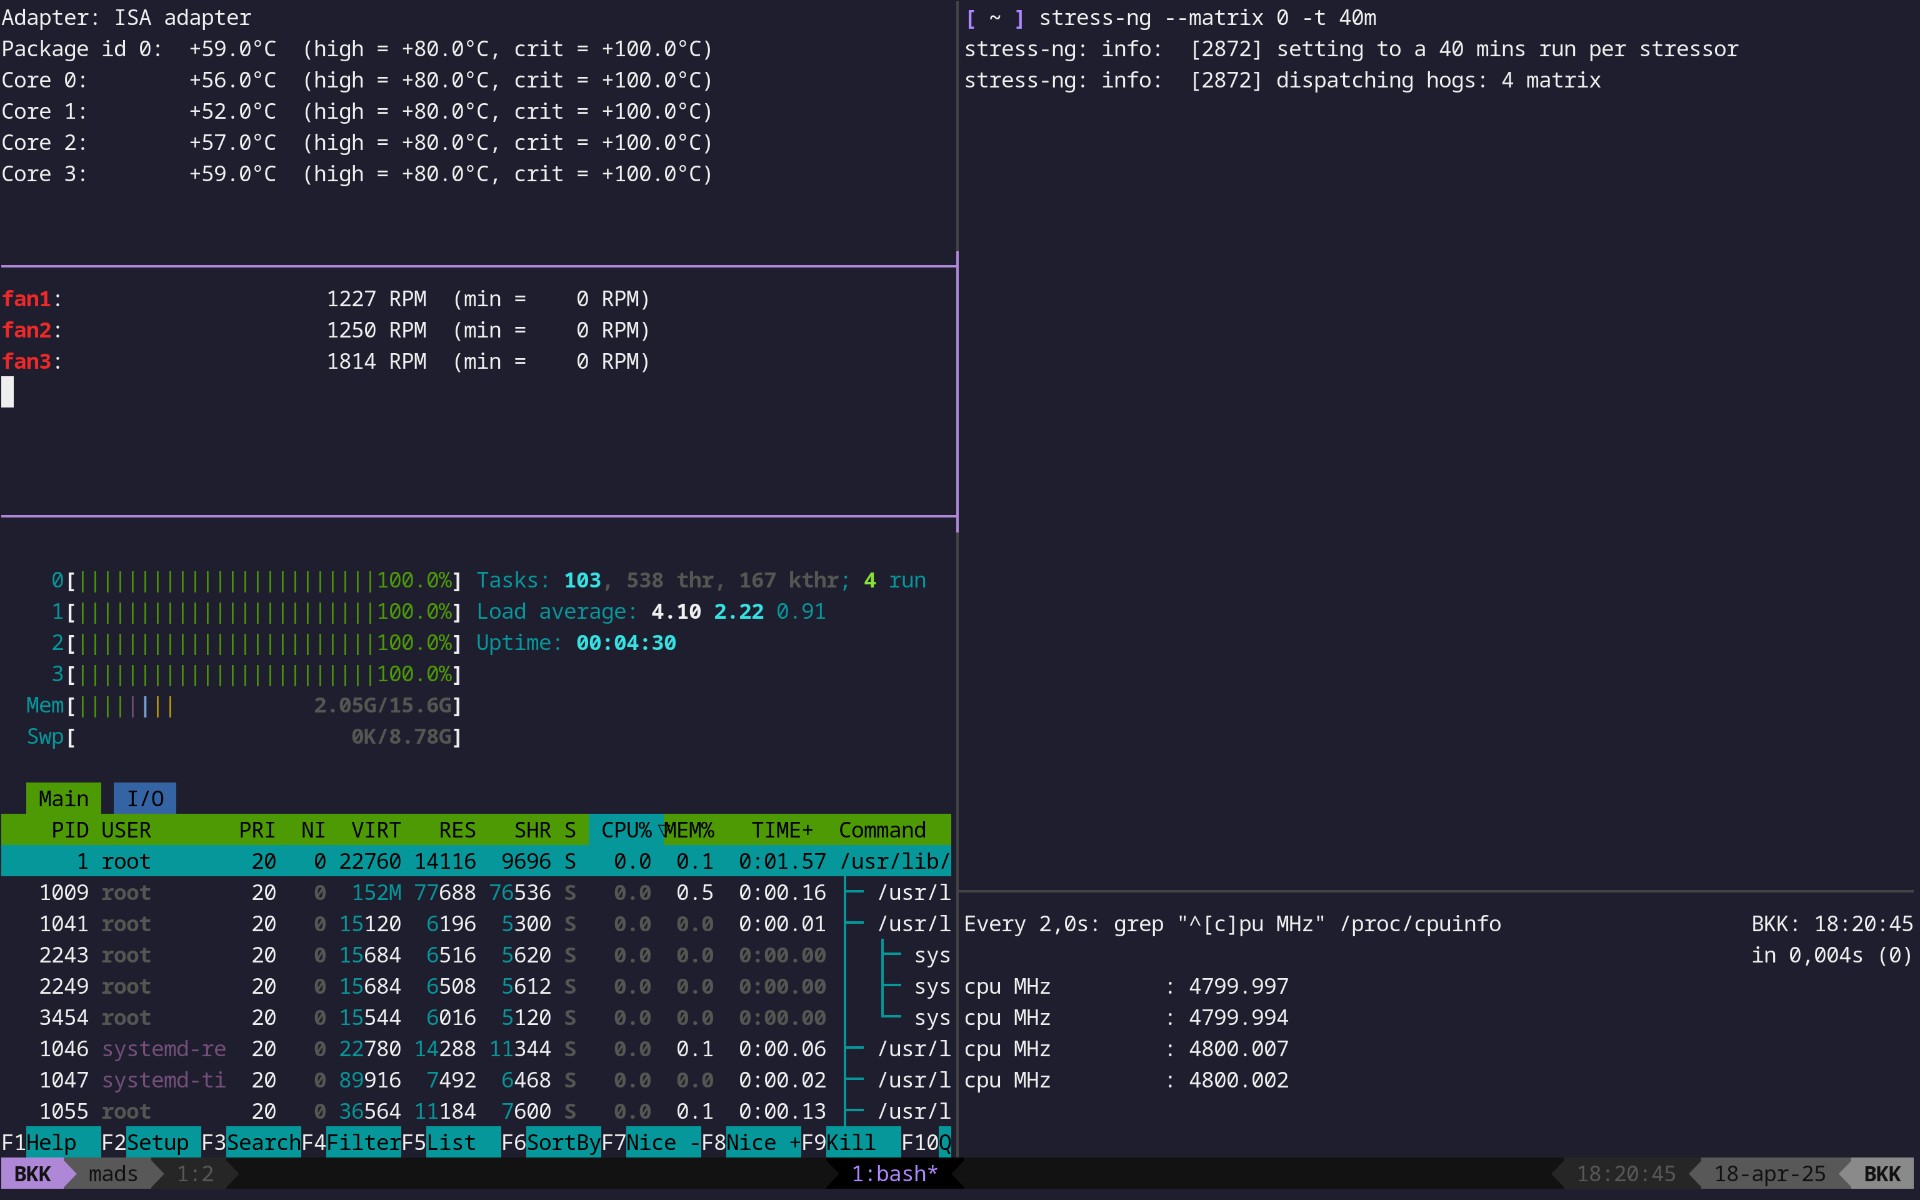
Each time I increase the overclock a bit I want to stress test the overclock and benchmark it. While I do that I want to keep an eye on many things: temperatures, CPU utilization, CPU core frequencies, fan speeds (even if don’t fully trust them), etc. There may be applications that can show me all of that in one package but really, who needs that kind of thing when you have the Unix philosophy of “Make each program do one thing well” and tmux? Here’s what’s going on in the screenshot above.
tmux
tmux is mostly for being able to attach to and detach from shell sessions in servers. What that means is that you can leave something you’re working on and come back without having to reopen everything. It’s basically the virtual antithesis of the Clean Desk Policy. It’s marvellous. Here, however, it’s more relevant that it allows me to divide and subdivide each ‘window’ in to many small terminals and start applications in them, just like Tilix.
stress-ng (top right)
There are many benchmarking and stress test applications out there, as well as applications that do actual, useful things but that double as stress testers (7zip, Handbrake, openssl etc.) I found stress-ng simple and useful for just driving CPU use to 100% across all cores. Note that there’s obviously a difference between benchmarking and stress testing. For the latter all I’m trying to do is make sure that the overclock doesn’t lead to instability or overly high temperatures when the CPU comes under high load.
--matrix 0 means that stress-ng can find out for itself how many threads to start to match the number of cores in the CPU. Alternatively it can be set manually, e.g. --matrix 1 for a single-threaded test. -t 40m is for how long the test should run (i.e. 40 minutes here). I know that proper stress testing is measured in hours not minutes but I first did a quick one to test whether it would buckle immediately. 6+ hours is for overnight testing, I think.
/proc/cpuinfo (bottom right)
cpuinfo lists a ton of information about each core in your CPU. The command
watch -n2 "grep \"^[c]pu MHz\" /proc/cpuinfo"prints it out every two seconds and grep’s the one useful bit from each core entry, namely the current clock frequency.
htop (bottom left)
htop needs no introduction. I only really use it here to ensure that CPU cores are indeed maxed out. That helped me catch that one time when a stress test wasn’t doing what I though it was.
By the way, today I learned that you can check the color codes in htop by just pressing ‘h’ which will take you to a simple quickhelp screen. Which informs me that red 100% isn’t actually ‘more’ than green or blue 100% it just means that it’s the kernel using up the cycles (and so is probably higher priority and less likely to give up ressources to that application you are just about to start).
sensors / fans (middle left)
sensors can be restricted to only showing output for a single module or chip. So if I want data from the newly discovered chip I mentioned earlier, all I need to do is
sensors nct6793-isa-0290If I want the command repeated and it’s output updated at regular intervals (much like watch but for command output instead of a file), I can put in a Bash while true loop. And if I only want the bit about my fans filter the output through grep.
while true; do
    sensors nct6793-isa-0290 | grep ^fan[1-3]
    sleep 2
    clear
done
sensors / temperatures (top left)
And then I do the same for CPU temperatures:
while true; do
    sensors coretemp-isa-0000
    sleep 2
    clear
done
Is more Mhz better, though?
Thanks to watch‘ing cpuinfo I know whether the overclock is in effect. That does not technically answer the question if I get more performance, though, cf. the distinction between stress testing and benchmarking.
The thing about benchmarking that struck me, is that if you just search for stuff, you’re likely to end up with overkill, at least when stepping from one multiplier to the next. I don’t really care how my CPU performance compares to others, even people with the very same model. All I need is a rough idea if pushing the chip further actually makes a difference in terms of performance. If not, I will stop whether or not there’s still headroom. The right way to do that might be to do some real world scenarios, games testing etc. That takes a lot of time, though.
So I did something else, far more basic. I asked sysbench to figure out all the prime numbers below 50M and then I noted how long that took. And after I realized that there might be some variance even with the same hardware settings, I repeated the exercise three times (that’s enough for statistical validity, right?)
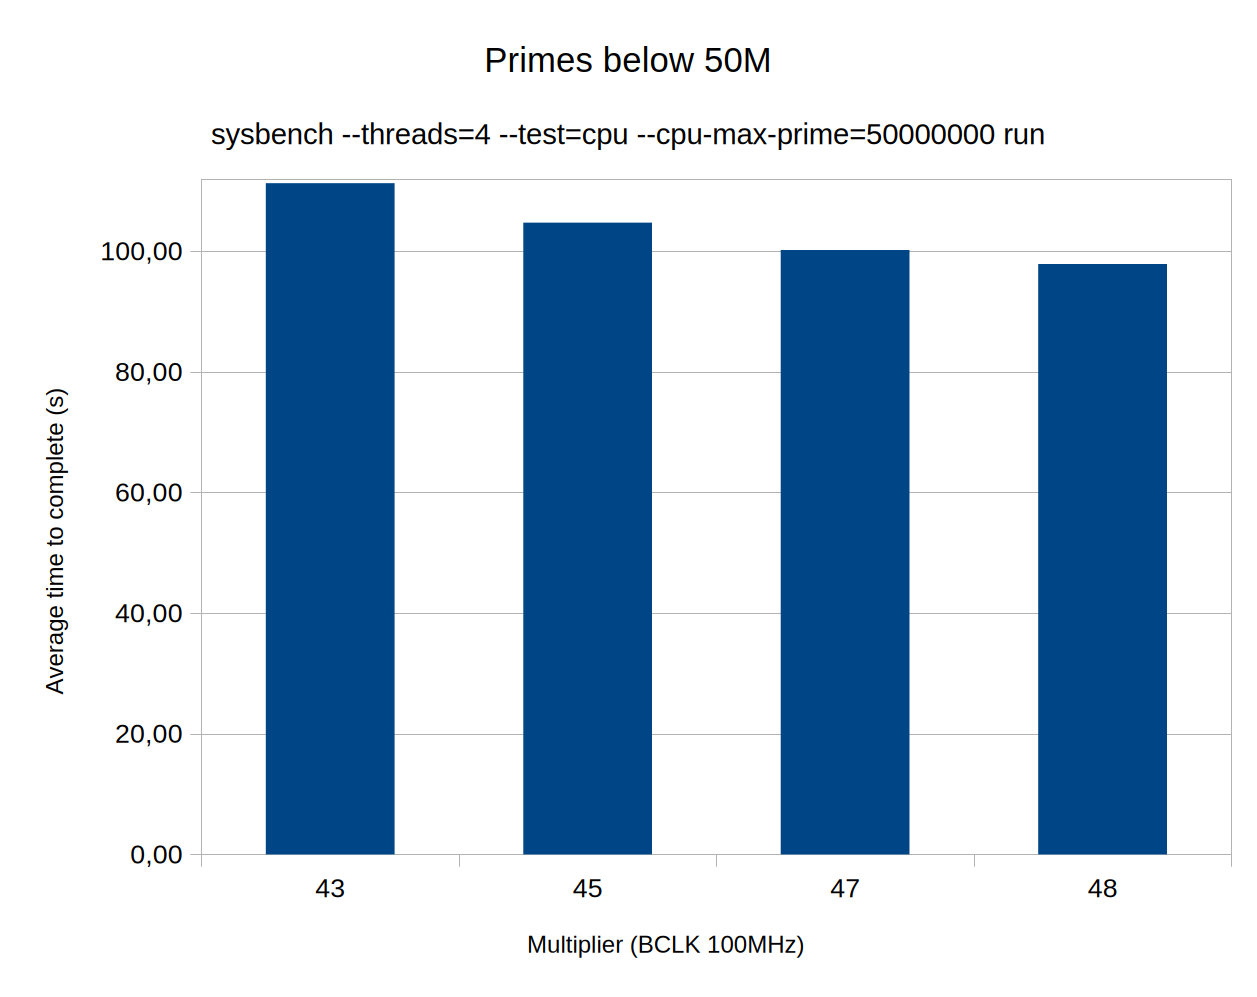
It’s probably no way to ensure proper measurements. It’s perfect for my purposes and only takes 2 minutes to complete. Note that the gains aren’t actually petering out, I just got more careful with the jumps.
As for the actual overclocking itself, I heartily recommend finding ressources that specifically adress both recommendations for the CPU’s capabilities (in my case this article on Anandtech) and how to implement the overclock on the motherboard (in my case this ROG article which is applicable to non-ROG ASUS mobos as well). That way I did not have to experiment with scary things like overvolting but could simply follow the recommendations and instructions.
How are thermals under load?
After reestablishing a more normal fan curve (‘Standard’ according to the BIOS) and closing up the case, I figured I would like to see a more realistic set of thermals.
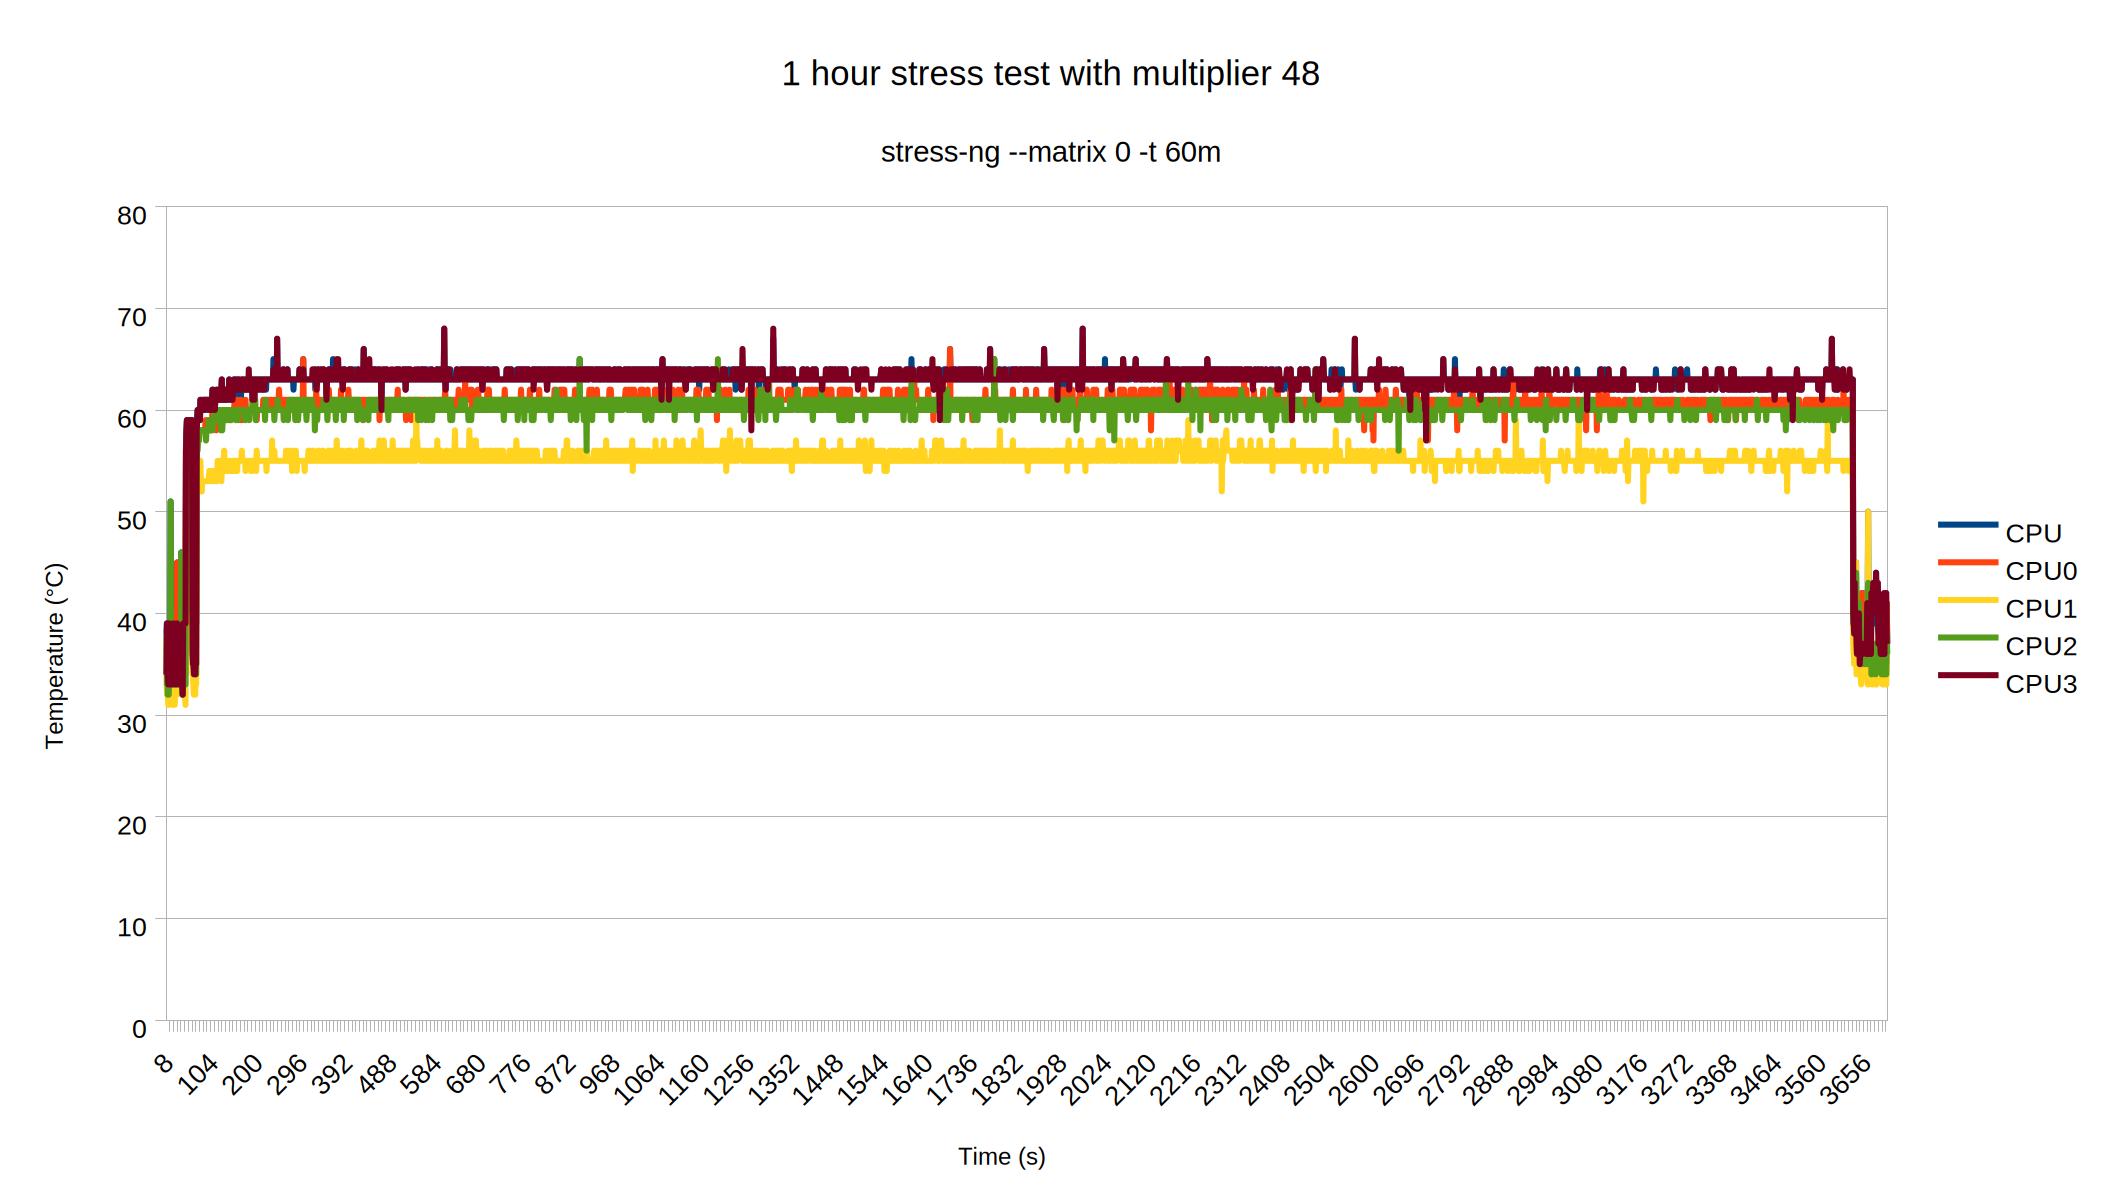
I have no idea why CPU1 is lower in the chart but I’m guessing either random core characteristics or random thermal paste distribution. Either way, not much I can do about it now. At any rate, this looked really good. I figured I should give it more of a ‘proper’ stress test, before proceeding, though. The experts seem to suggest that a proper test a) needs to run for hours and hours and b) use tools that properly challenge the CPU. Which apparently some do more than others despite htop reporting 100% all the time for stress-ng? What do I know. I left Handbrake to convert the same video over and over overnight (it sat up and watched Return of the King 6½ times which is a bit much even if you really like the trilogy). Turns out that is a wise call because now the picture looks like this.
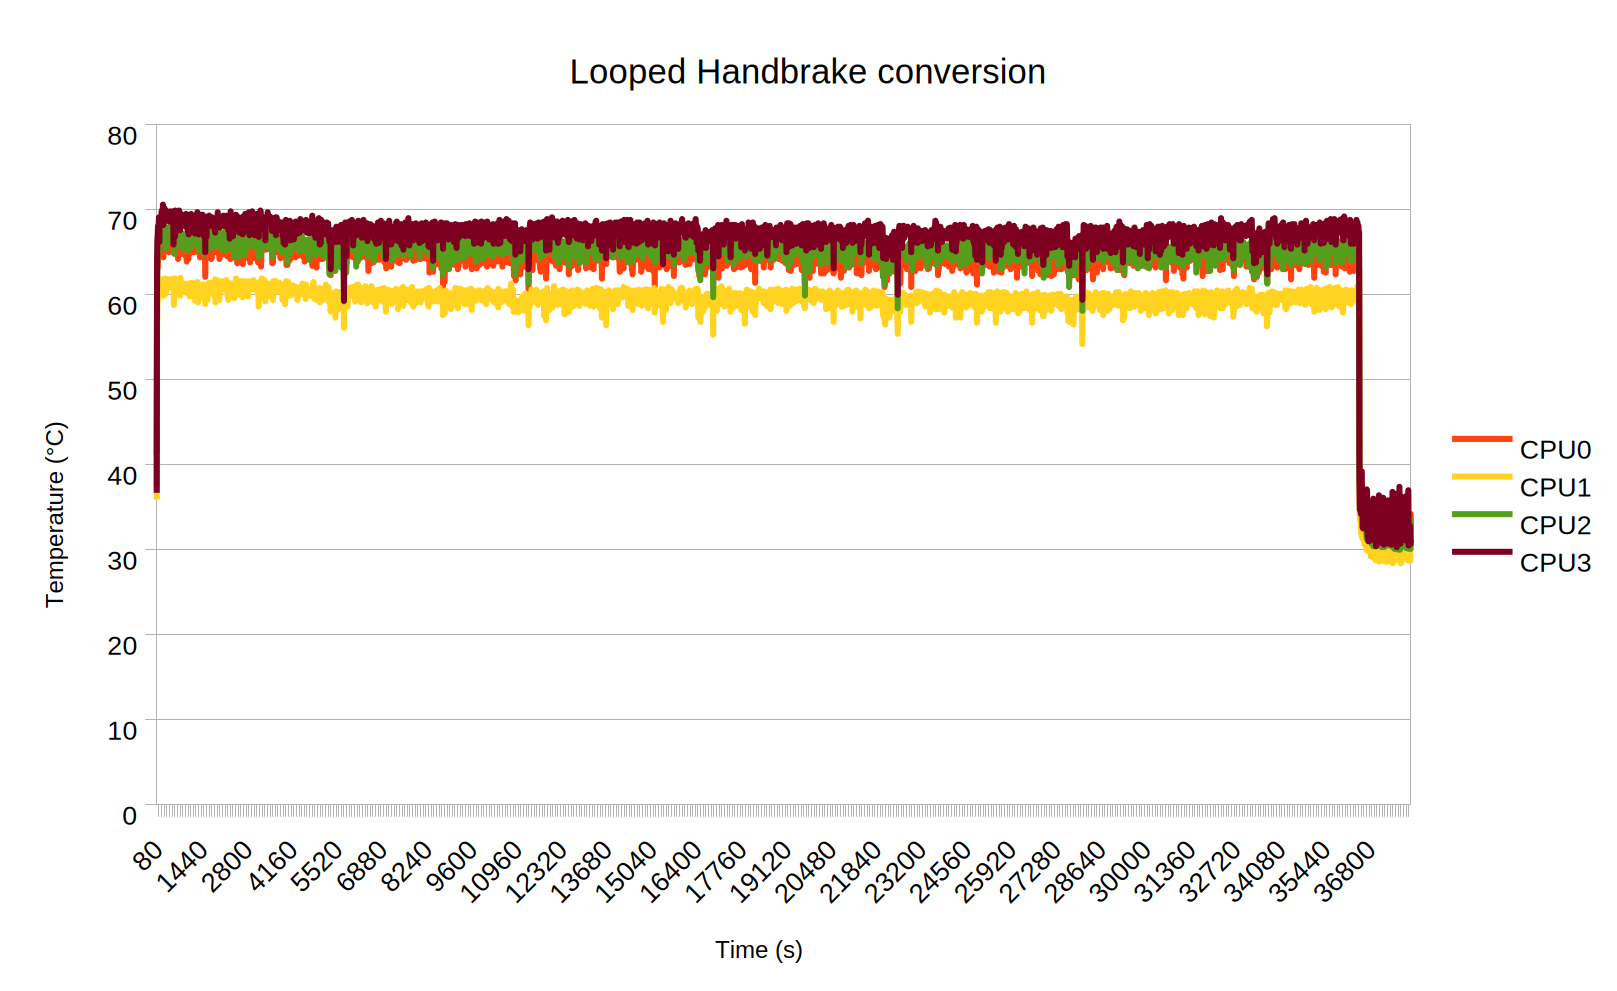
As is apparent, everything has shifted up about 6-7 °C. And that is not even accounting for the fact that the Handbrake dataset had 1 observation per second for ten hours so I had to do 10 sec averages to be able to work with it (Libreoffice Calc isn’t very good at handling large data sets). Which means that some of the peaks above 70°C have been smoothed out. I suspect that the sensible thing to do next – before even considering going above 4.8 GHz – is to get the case as toasty as possible by exercising the entire system – CPU, GPU, IO, etc. all at the same time and see how well it handles that.
Anyway, in case anyone is interested in copying the experiment above, there is an awful set of pipes that produced the rough data output needed:
while true; do
    sensors -u coretemp-isa-0000 | \
    grep _input | grep -Eo '[0-9]+\.[0-9]+' | \
    sed -z 's/\n/,/g' >> \
    48_stressng_1sec.txt; \
    echo >> 48_stressng_1sec.txt \
    sleep 1
done
Conclusion
So that’s it. The old dog did seem able to learn a few new tricks. Thanks to the extra CPU oomph the RDR2 benchmark now just manages to stay above 60 fps even when Arthur Morgan barges through that door out on to the streets of Saint Denis. Obviously, I could have got a much larger performance bump by just buying even a bottom budget CPU of today. However, nudging out just sufficient performance from this ancient machine to make it last a few more years is somehow far more satisfying to me than any tech upgrade. Not only does it save me money and cuts down on tech trash – i.e. good for the environment – it makes the gains feel earned and has taught me a lot about hardware..